Market Structures MT5
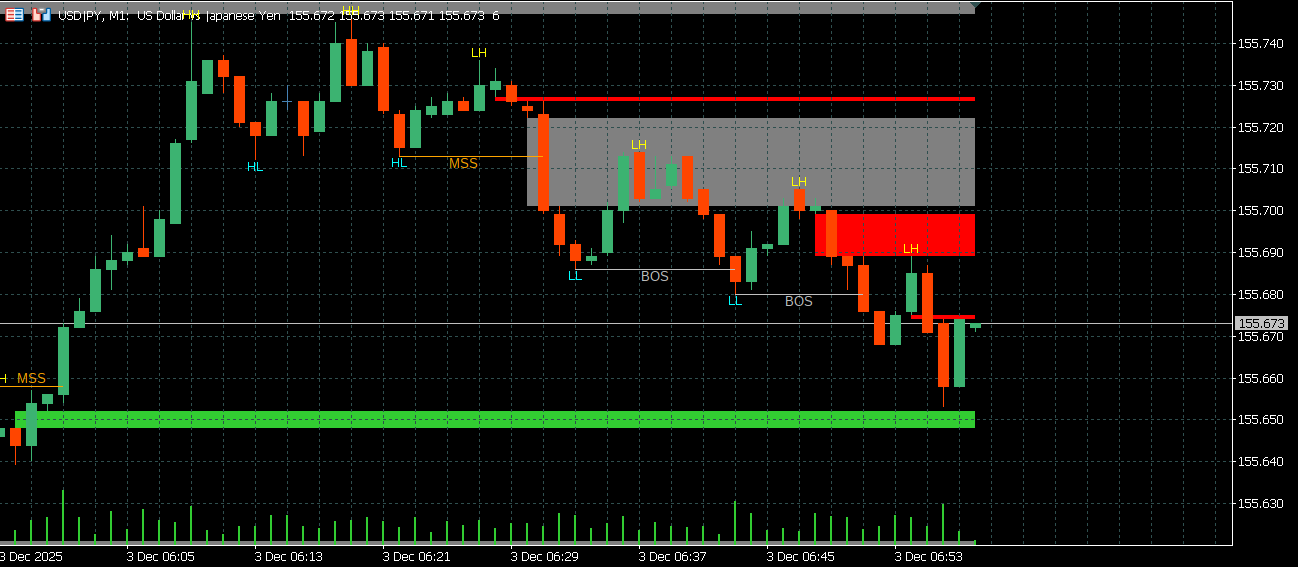
A powerful MetaTrader 5 indicator designed to visualize market structures based on the Smart Money Concepts (SMC) framework. Features include Pivot Detection, Break of Structure (BOS), Market Structure Shift (MSS), and Fair Value Gaps (FVG).
 Visualize market structures with professional precision.
Professional Insight for Your Chart
Market Structures MT5 is a powerful indicator for MetaTrader 5 that brings Smart Money Concepts (SMC), a methodology increasingly used by professional traders and institutions.
It captures complex market movement as “structure,” automatically visualizing trend continuation, reversal points, and key zones where price is likely to react. This helps you see the market’s essence without being misled by noise.
Key Features
1. Swing High and Swing Low Labels
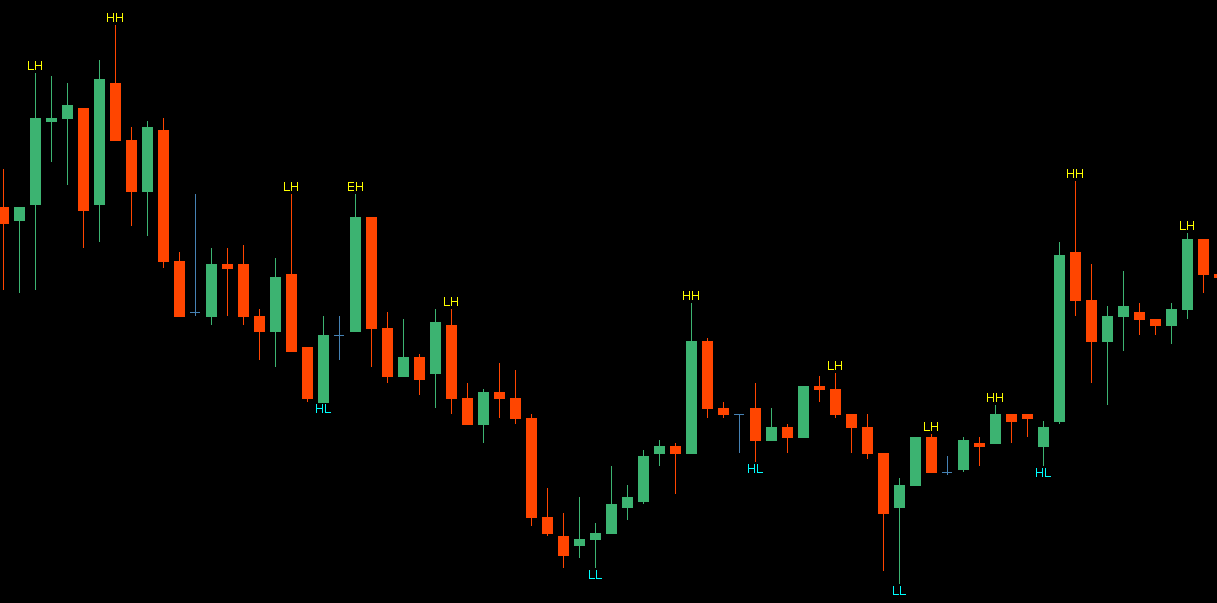
Analyzes price action and labels swing highs and swing lows on the chart.
Swing highs and swing lows are confirmed turning points where price clearly reverses, not just wick spikes or temporary noise. They are core to SMC structure analysis. Accurately identifying swings helps you judge trend continuation, reversals, and liquidity objectively.
The following six labels are displayed:
- HH (Higher High)
- HL (Higher Low)
- LH (Lower High)
- LL (Lower Low)
- EH (Equal High)
- EL (Equal Low)
HH/HL/LH/LL compare swing highs and lows to define market structure. A sequence of HH and HL indicates an uptrend, while LH and LL indicates a downtrend. Tracking these changes helps you see trend continuity and break events (BOS/MSS) visually and logically.
EH/EL are swings formed at the same price as the previous swing. These tend to attract stop orders and are treated as key liquidity zones in SMC, often leading to breaks or reversals.
2. BOS (Break of Structure) and MSS (Market Structure Shift)

Displays BOS and MSS events that represent trend continuation or reversal in SMC market structure.
BOS (Break of Structure)
BOS occurs when a key swing high or swing low is broken in the trend direction. It signals trend continuation and can indicate institutional position building.
MSS (Market Structure Shift)
MSS is when the previously maintained structure breaks in the opposite direction, often signaling a potential trend reversal or the start of a major correction. Distinguishing BOS from MSS improves context accuracy.
BOS/MSS in External vs Internal Structure
SMC often separates structure into external (higher timeframe) and internal (lower timeframe). External structure defines the broader trend. An external BOS signals strong continuation, while an external MSS suggests a possible medium-to-long term reversal. Internal structure forms during pullbacks; internal BOS marks temporary momentum shifts, and internal MSS provides early entry timing. Tracking both gives directional clarity and more precise entries.
Turning Structure into Entries
Use external structure to identify the broader direction. If external BOS is present, assume continuation; if external MSS appears, treat it as a potential reversal. Then move to the lower timeframe and wait for internal structure changes that align with the external direction. Combine that with other SMC evidence such as FVG to confirm an entry and reduce emotional bias.
Step-by-step entry framework
- Confirm external structure and overall direction. External BOS implies continuation; external MSS implies reversal risk.
- Switch to a lower timeframe and wait for internal BOS/MSS aligned with the external direction as an entry prep signal.
- Combine with other SMC factors such as FVG to execute with higher precision.
3. Fair Value Gap (FVG) Display
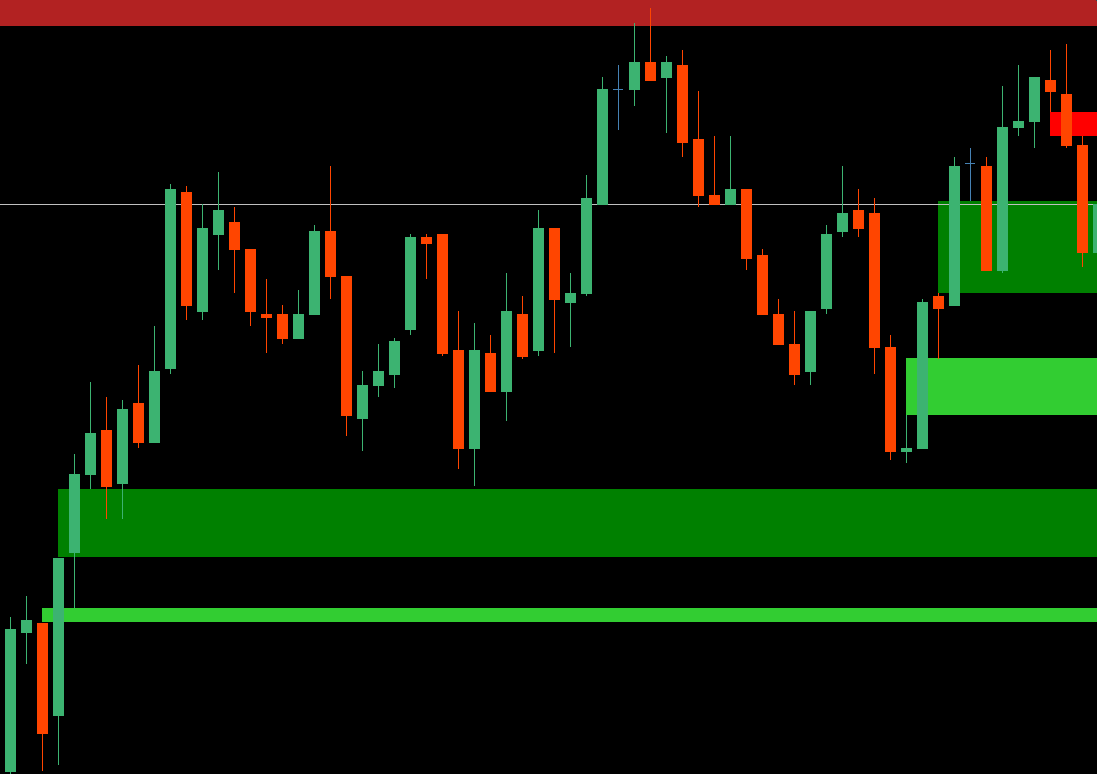
Detects and displays FVG zones on the chart.
An FVG is a price imbalance created by rapid moves where trading was thin between candles. It is often treated as the footprint of strong institutional orders. In SMC, price frequently returns to these zones, making them attractive pullback or entry candidates when combined with structure.
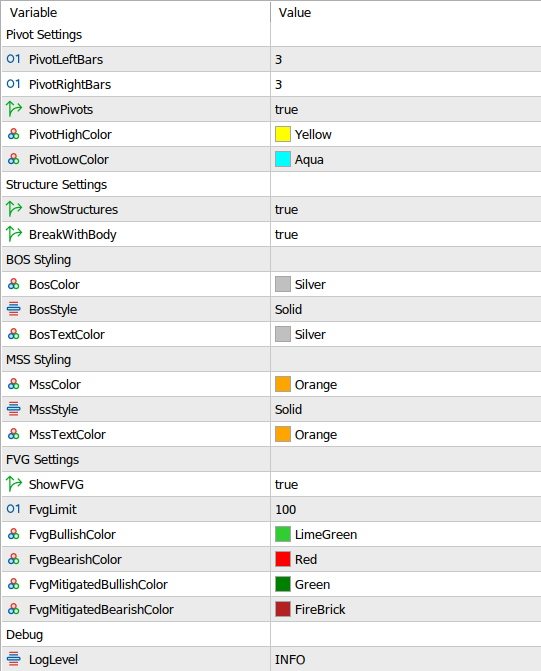
Parameters
Fine-grained settings let you match the indicator to your trading style.
- Pivot sensitivity: Set left/right bar counts to align with your preferred timeframe, from short-term to long-term waves.
- Break validation: Choose to confirm breaks with candle bodies only, or include wicks. Body-only validation filters for stricter confirmation.
- Visual styling: Customize pivot label colors, BOS/MSS label and line styles, and bullish/bearish/mitigated FVG colors.
| Parameter Group | Setting | Description | Default Value |
|---|---|---|---|
| Pivot Settings | PivotLeftBars | Number of bars to the left required to identify a pivot (top/bottom). Increasing this catches larger waves. | 3 |
PivotRightBars | Number of bars to the right required to identify a pivot. Affects lag until confirmation but increases reliability. | 3 | |
ShowPivots | Toggle pivot markers on/off. | true | |
PivotHighColor | Color for high pivots. | clrYellow | |
PivotLowColor | Color for low pivots. | clrCyan | |
| Structure Settings | ShowStructures | Toggle BOS/MSS lines on/off. | true |
BreakWithBody | Whether to determine structure breaks (BOS/MSS) by candle body. If true, a break is confirmed when the body crosses the line. | true | |
| BOS Styling | BosColor | BOS line color. | clrSilver |
BosStyle | BOS line style. | STYLE_SOLID | |
BosTextColor | BOS label color. | clrSilver | |
| MSS Styling | MssColor | MSS line color. | clrOrange |
MssStyle | MSS line style. | STYLE_SOLID | |
MssTextColor | MSS label color. | clrOrange | |
| FVG Settings | ShowFVG | Toggle FVG zones on/off. | true |
FvgLimit | Maximum number of FVGs retained on screen. | 100 | |
FvgBullishColor | Bullish FVG color. | clrLimeGreen | |
FvgBearishColor | Bearish FVG color. | clrRed | |
FvgMitigatedBullishColor | Mitigated bullish FVG color. | clrGreen | |
FvgMitigatedBearishColor | Mitigated bearish FVG color. | clrFireBrick | |
| Debug | LogLevel | Log verbosity for troubleshooting. | INFO |
Who It’s For
- Discretionary traders seeking precision: Rule-based structure mapping improves consistency.
- Traders who want clear entry logic: BOS/MSS plus FVG zones make context actionable.
- Anyone tired of noisy charts: Focus on the levels that truly matter.
Use Market Structures MT5 to add consistency and evidence to your daily analysis.